Gazemap
2020
ReactPythonMUIFastAPID3VisualisationsAuthenticationFirebaseWhat I Built
Eye movement research generates a lot of data that’s hard to interpret in isolation. Gazemap lets researchers load datasets and explore them through multiple linked visualizations. Select a time range in one chart and the others update to match.
The frontend is React with D3.js for the charts. The backend is FastAPI (Python) handling data processing. Firebase Auth keeps things behind a login.
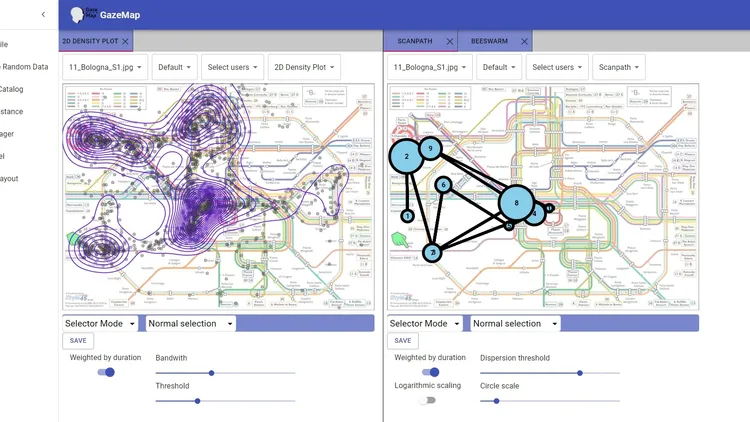
Visualizations
- 2D Density Plot: where attention concentrated in 2D space
- Scanpath: the sequence of fixations and saccades over time
- Bee Swarm: distribution of eye movements across participants
- Scarf Plot: eye movement patterns as a time series
The “linked” part is the interesting bit: interacting with one visualization filters or highlights the others, which makes it much easier to spot patterns across different views of the same data.
What I Learned
- D3.js is powerful but has a steep learning curve, especially when you need multiple charts to share state
- FastAPI is a great fit for data-heavy Python backends; the automatic OpenAPI docs alone save a lot of back-and-forth
- Building for researchers means thinking about edge cases in data formats that normal web apps never encounter